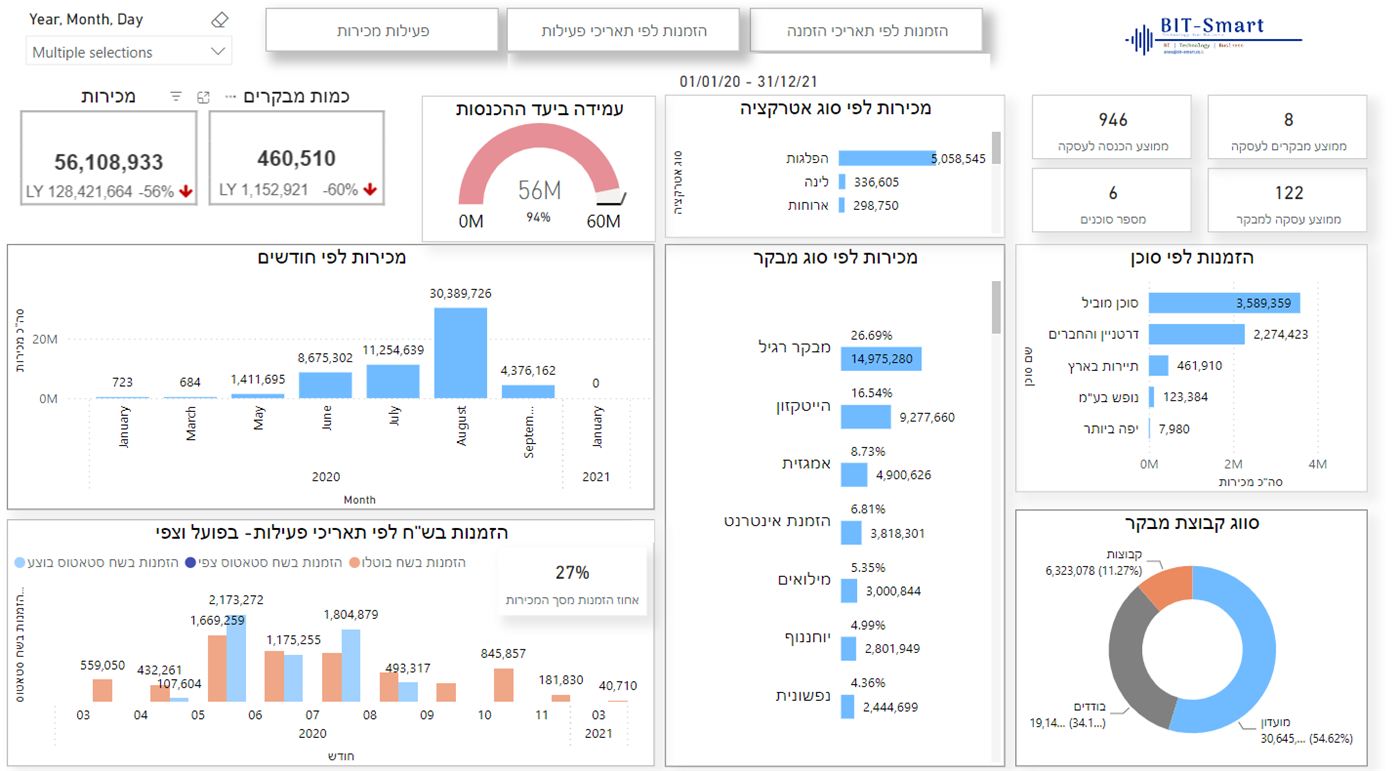
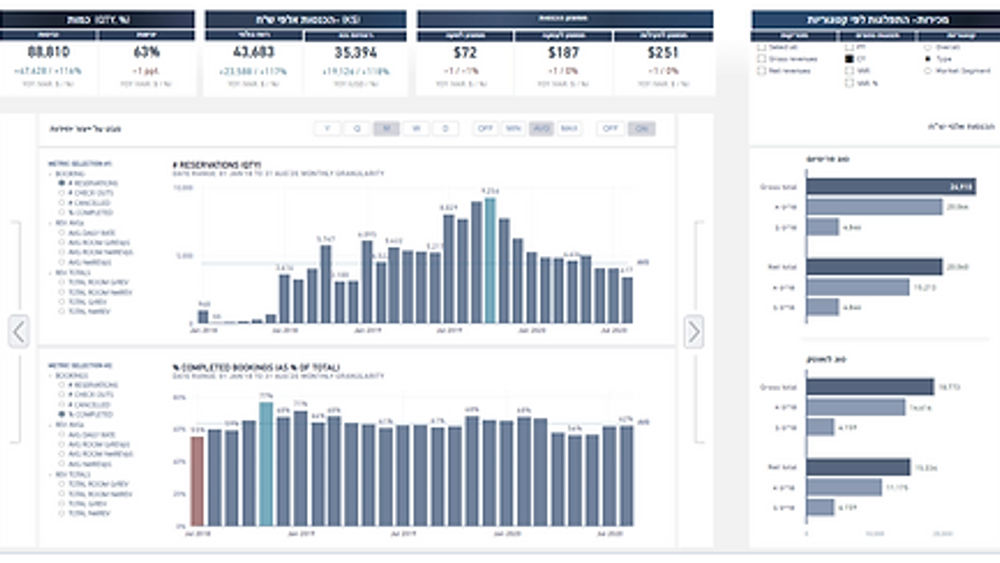
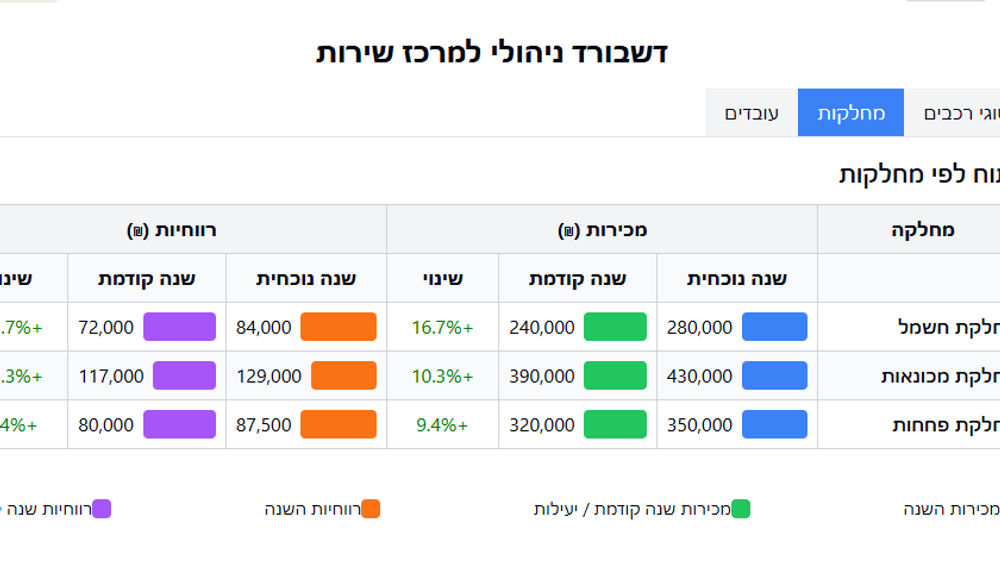
A demonstration of defining metrics and requirements for a dashboard for a company that sells attractions, cruises and lodging
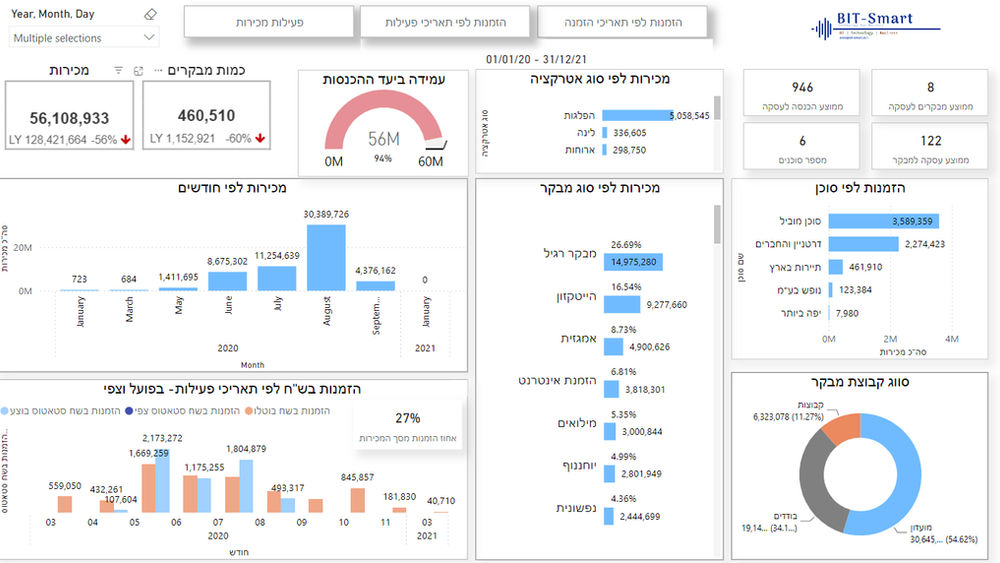
The goal is to take into account a wide range of metrics that will help us understand the business's performance and draw conclusions for improving processes and making better decisions.
Here are some examples of metrics that may be relevant:
Total number of visitors:
The total number of visitors to each attraction or site, including breakdown by days, weeks, months and seasons.
Visitors by attraction:
Distribution of visitors by types of attractions, cruises, lodging and additional activities.
Number of snack-bar buyers:
A metric covering the number of customers who buy food and drinks from snack bars or shops inside the attractions or ships.
Bookings vs. actual visits:
A comparison between the number of advance bookings made and the number of actual visitors who arrived at the attractions, cruises or lodging sites.
Booking fulfillment rates:
The percentage of visitors who booked in advance versus those who actually showed up, to identify trends of cancelled bookings.
Total revenue:
Total revenue from ticket sales, cruises, lodging and food, combined with a breakdown by categories.
Cost per visitor:
Measuring the average cost per visitor who arrives at the attraction, ship or lodging site.
Average revenue per visitor:
Average revenue per visitor for the attractions, cruises or lodging.
Booking sources: analysis of booking sources (telemarketing, online, etc.'), to assess the effectiveness of the different booking channels.
Demographic data: analysis of visitors by age, gender, geographic location and other metrics, to understand the customer profile.
Customer satisfaction metric: analysis of feedback and surveys to measure satisfaction with the attractions, cruises or rooms.
Customer experience metric (NPS): Net Promoter Score (NPS) to assess customers' willingness to recommend the company to others.
Seasonality and weather: identifying the effects of weather and the seasons of the year on visits and sales, in order to prepare accordingly.
Repeat-visit rate: the percentage of visitors who return to the attractions, cruises or lodging a second time.
Workforce reports: the number of employees required for each activity, analysis of their working hours, and how this affects output and profitability.
These metrics will provide a comprehensive picture of the business's work processes and help build insights on improving operations and sales, and on better understanding the customer base.