Business intelligence for Amazon: how to turn Amazon data into real profit
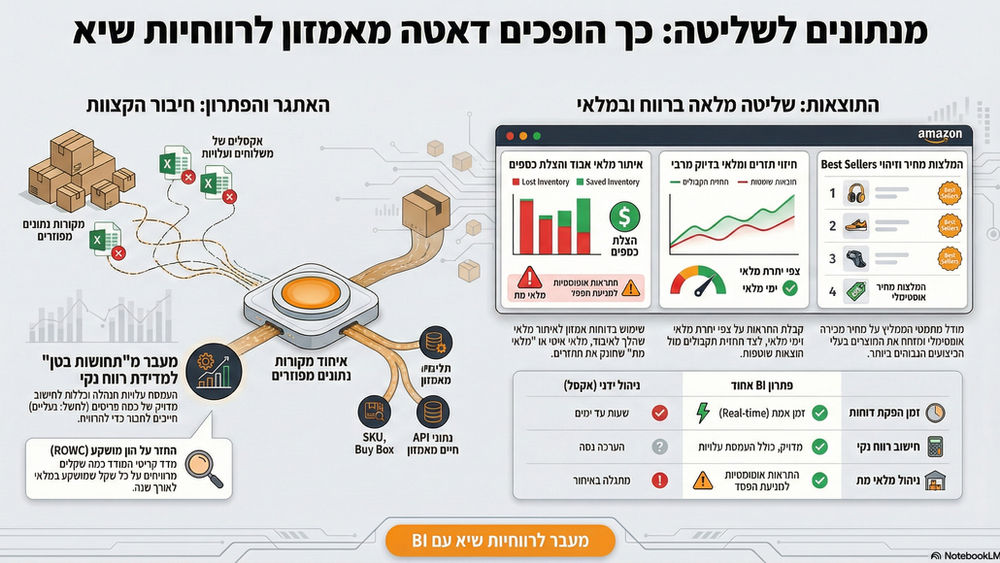
Amazon is one of the richest platforms in the world for business data. Every sale, every return, every search, every click is recorded. Everything is saved. Everything is accessible.
So why do so many sellers still not know whether they are profitable? And what is their real situation?
What Amazon gives you, and what it doesn't
Amazon reports are excellent at what they do: seeing how many units were sold, what the gross revenue is, and what the fees are.
But real business management requires more than the reports you get on the platform.
What Amazon doesn't connect for you is your costs.
The purchase cost of each item. Shipping cost from the supplier. Payment terms. Overhead costs.
Only when you connect all this data to the Amazon data do you get a real picture.
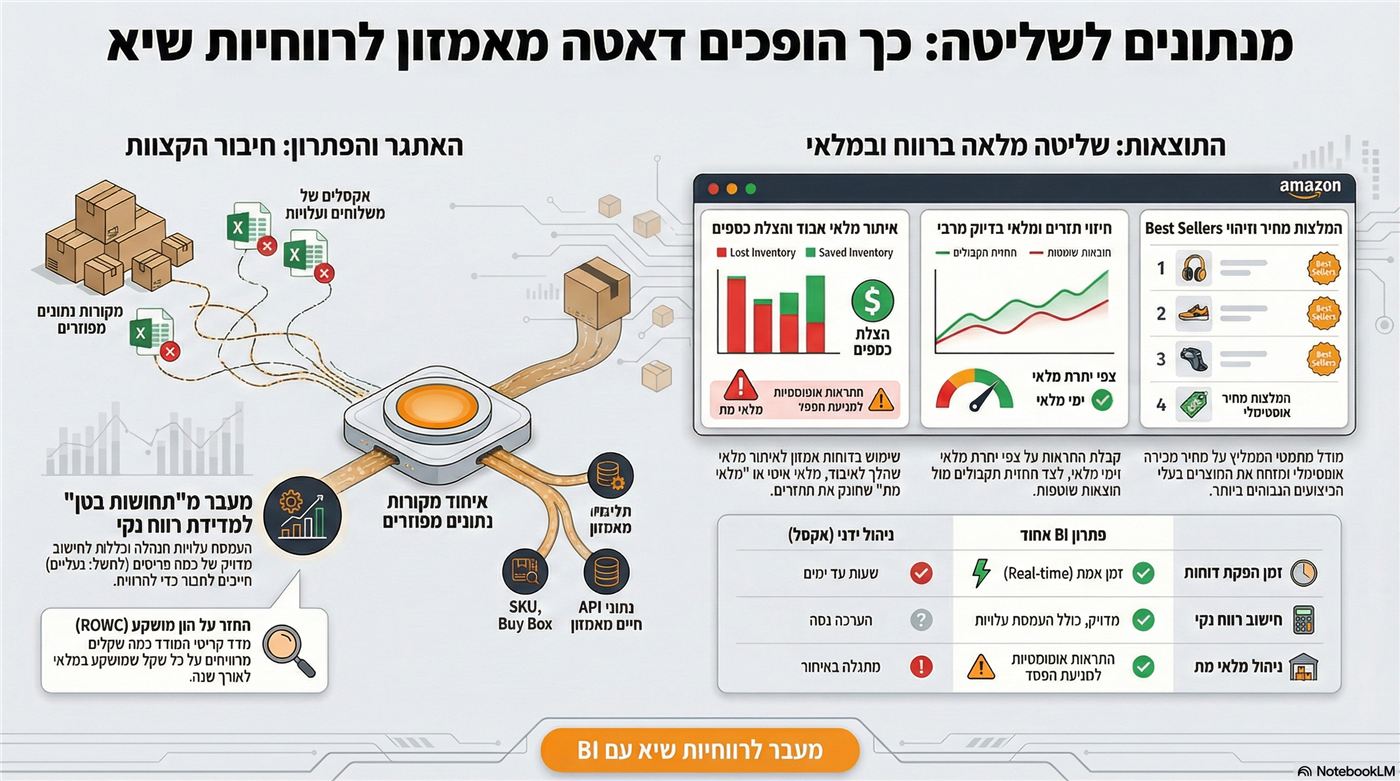
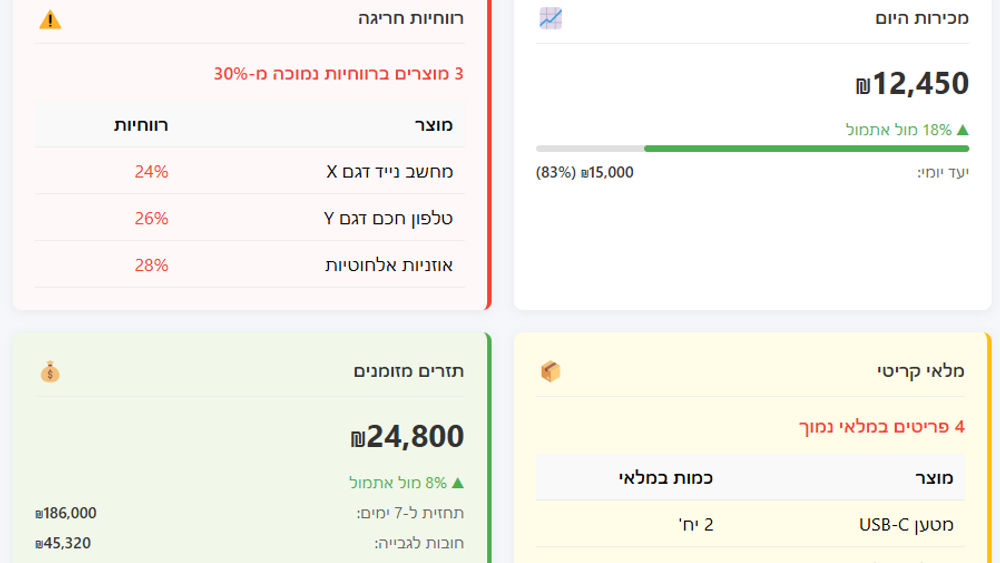
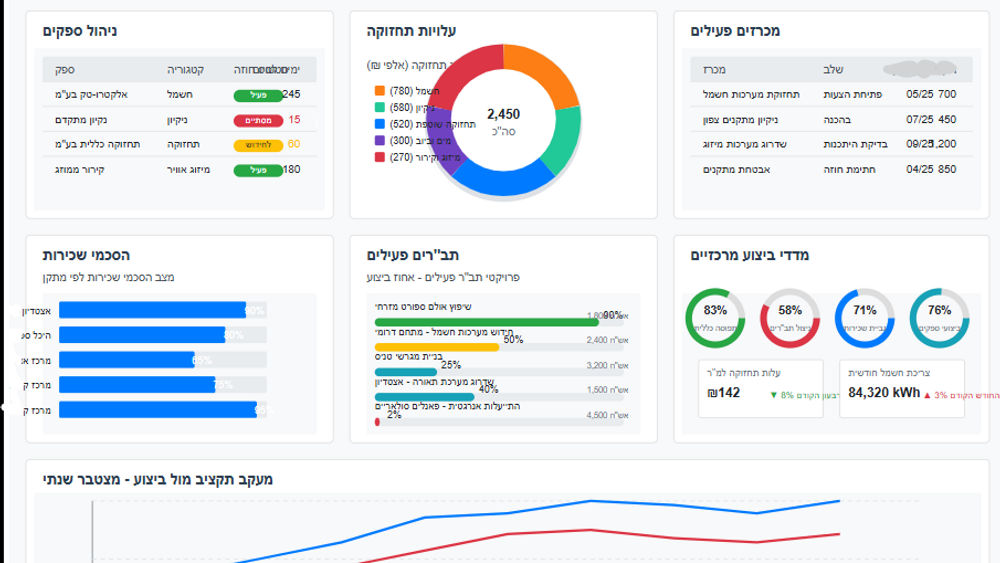
This is where an Amazon BI system comes in, a business intelligence solution that unifies all information sources into one management dashboard tailored to you, to your real needs and costs (management, loans, purchasing...).
Gaps you won't get from the platform:
ASIN vs. SKU
This is one of the most common management pain points among FBA sellers, and one of the most significant.
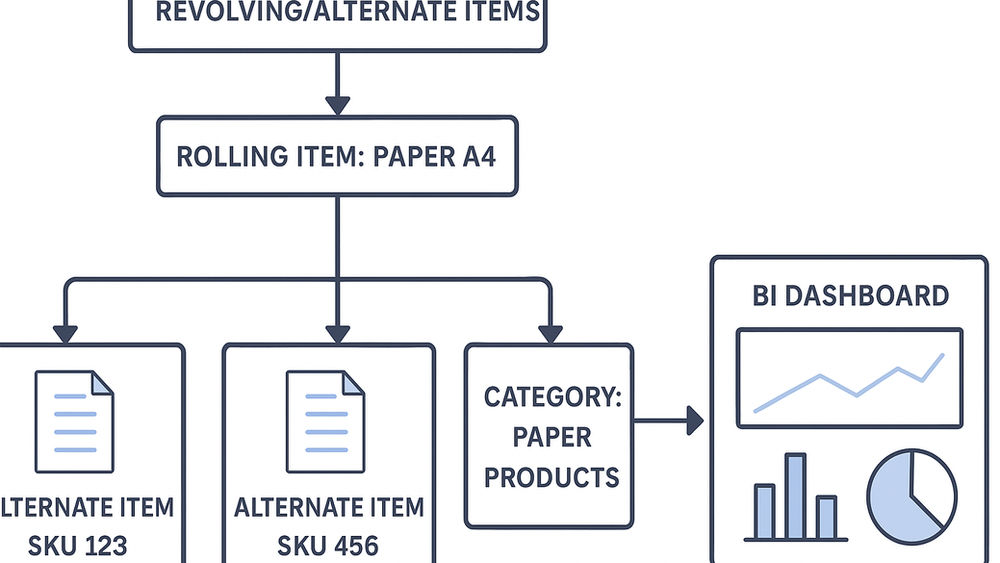
Amazon manages inventory by ASIN, its product identifier. But in your business, every product is managed by an internal SKU that reflects variants: color, size, packaging, production lot.
One product under one ASIN can include 10 different SKUs with completely different costs. Amazon reports everything together.
You need to manage each one separately.
What this actually causes:
Calculating profitability by SKU is impossible with the data as Amazon provides it
Inventory that looks sufficient at the ASIN level is actually short in the best-selling variant
Pricing that looks right at the ASIN level but loses money in certain sizes
The solution in Amazon BI:
Two parallel management layers: a status picture at the ASIN level for managing with Amazon, and a status picture at the SKU level for internal management.
Every profitability, cost and inventory calculation is performed at the SKU level, and is also displayed aggregated at the ASIN level.
Two eyes on the same data, each from the right angle.
Amazon profitability: how much do you really earn?
This is one of the most common questions Amazon sellers ask, and one of the hardest to answer accurately.
Costs hide everywhere: Referral Fee, FBA cost (storage and shipping), Pay-Per-Click, returns, marketing and overhead costs that need to be "loaded" onto each product.
A full profitability calculation in BI covers three levels for each SKU:
Level | What it includes |
Gross profit | Selling price minus direct product cost |
Operating profit | After Amazon fees, shipping and FBA storage |
Net profit | After everything: overhead, advertising, indirect costs |
What-If analysis: what happens when you "play with the numbers"?
One of the most powerful tools in an Amazon BI system is What-If scenario analysis with cost allocation.
General overhead costs, rent, payroll, software, are real, but not specific to one product.
They need to be allocated across all SKUs.
The question is: how? And what happens when you change the assumptions?
Examples of What-If questions the system answers:
"What happens to profitability if the rent rises by 20%?" The system instantly calculates which SKUs will go from profit to loss."
"What happens if we increase sales by 30%?" Will profit grow proportionally, or do variable costs grow faster?
"What is the minimum number of units needed to cover all upcoming expenses?" A question you need to know the answer to before the start of every month, not at its end.
"What happens if the purchase cost drops by 5%?" A new BEP calculation and additional potential profit per unit.
The power of What-If is asking questions before reality forces you to.
Inventory that looks like it exists, but isn't really there
A pain most sellers discover after the damage is already done:
Reserved Inventory — physical units in an Amazon warehouse that are not available for sale: in transfer between warehouses, in receiving inspection, in returns processing.
Stranded Inventory — units in the warehouse that are not shown to customers because of a listing problem. The goods sit, the storage fee keeps running, and there are no sales.
Lost Inventory — units you shipped and paid the supplier for, but that do not appear in the reports. You can claim compensation from Amazon, but you have to find them first.
The solution: we build an automation report that compares your shipment records with Amazon's reports, and generates a gap report for opening cases and receiving compensation.
FBA inventory management: between Out of Stock and unnecessary storage costs
Out of Stock
Running out of stock ruins rankings and wastes advertising budget. Excess inventory erodes profitability through storage fees.
The BI system manages both sides
Status | Alert | Recommended action |
🔴 Expected Out of Stock within 14 days | High urgency | Order inventory from the supplier immediately |
🟡 Days of inventory over 90 | High storage cost | Lower the price or remove inventory |
⚫ Zero sales in 60+ days | Dead inventory | Liquidation, aggressive promotion, or return |
Stranded Inventory | Revenue loss | Immediate price correction |
It should be noted that the platform also gives recommendations, but they do not always reflect adjustments and recommendations that suit you and your goals or the real situation. For example, a recommendation to lower the price of an item that sells well, stemming from similar products on the platform (which are not really available, or whose competitors have a lower rating), so there is no effect on the item's sales and the price can even be raised.
FBA fees: when the next update changes the whole account
Amazon fees now consume more than 50% of the revenue of many sellers, and they keep rising.
The problem: most sellers do not calculate the impact until they see the monthly report.
The system calculates in real time:
FBA fee by size and weight, for each SKU separately
When Amazon updates fees: what the impact is on each product
What-If:
"What happens to profitability if FBA fees rise by another 10%?"
Cash flow that surprises for the worse
In an Amazon business, the cash-flow gap is built in:
You pay the supplier today, the goods reach Amazon in 30–45 days, and Amazon pays after another 14 days. You finance 60–75 days ahead, every time.
In the BI system you can build a 30/60/90-day cash-flow forecast:
Planned cash outflows according to supplier invoices
Expected receipts according to the sales rate and Amazon's payment schedule
Cash-flow gaps: days when outflows exceed inflows
Capital locked in inventory: how much money is "sitting" as products in the warehouse
Betting on the right products: Buy Box and advertising
When a product runs out, Amazon may see you as unreliable, which lowers your ranking, wastes advertising budget, and increases competition.
A business intelligence system can calculate a combined performance score for each product:
Priority score = sales volume × margin × growth rate
The score lets you identify the 20% of products that generate 80% of the profit, and direct the advertising budget, inventory and time toward them.
The questions every Amazon seller must be able to answer
What are your inventory balances, at the SKU level, in real time?
Is all the inventory you shipped displayed and listed for sale?
Did items disappear? And what is the value of the compensation you are owed?
How much does each item really cost you, including allocation of overhead?
What is the minimum price below which you sell at a loss?
How many units do you need to sell this month to make a profit at all?
What will happen to profitability if shipping costs rise by 15%?
What is happening with your cash flow over the next six weeks?
If we haven't answered all these questions with full confidence, this is exactly where BI for Amazon comes into the picture.
The sellers who win won't necessarily be those with the best products. They will be those who understand their data and make faster and more accurate decisions than their competitors.
An Amazon BI system is not an expense! It is an investment that pays for itself: by stopping hidden losses, by smart inventory management, by fact-based pricing decisions, and by cash-flow management that won't surprise you for the worse.
The journey from "I think we're profitable" to "I know exactly how much and from where" starts with connecting the data, the knowledge and the sources.
Let's sit down for a coffee ☕
We invite you to a short conversation, to understand together your potential for transparency and smart management of your store.
Contact us and we'll set up a meeting.