Simple, fast reports for effective business management: 10 minutes of work that will save you a lot of money
As a business manager, one of the most challenging tasks is making smart decisions quickly. The best way to do this is through simple daily reports that provide an accurate snapshot of the business. These reports don't have to be complicated or take hours to prepare; they can be set up within minutes and deliver enormous value.
Why are daily reports so important?
Businesses that monitor their performance daily respond faster to changes in the market and make better decisions.
The difference between identifying a problem within a day versus identifying it at the end of the month can be very significant for the bottom line.
Examples of money-saving daily reports
1. Exceptional profitability report
What it shows:
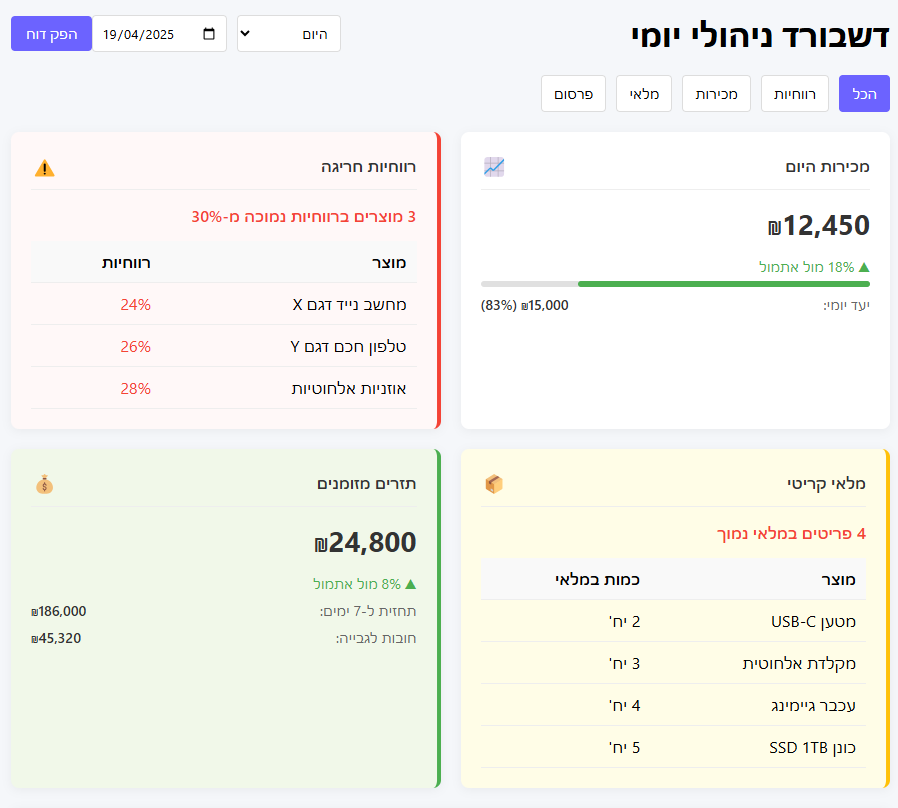
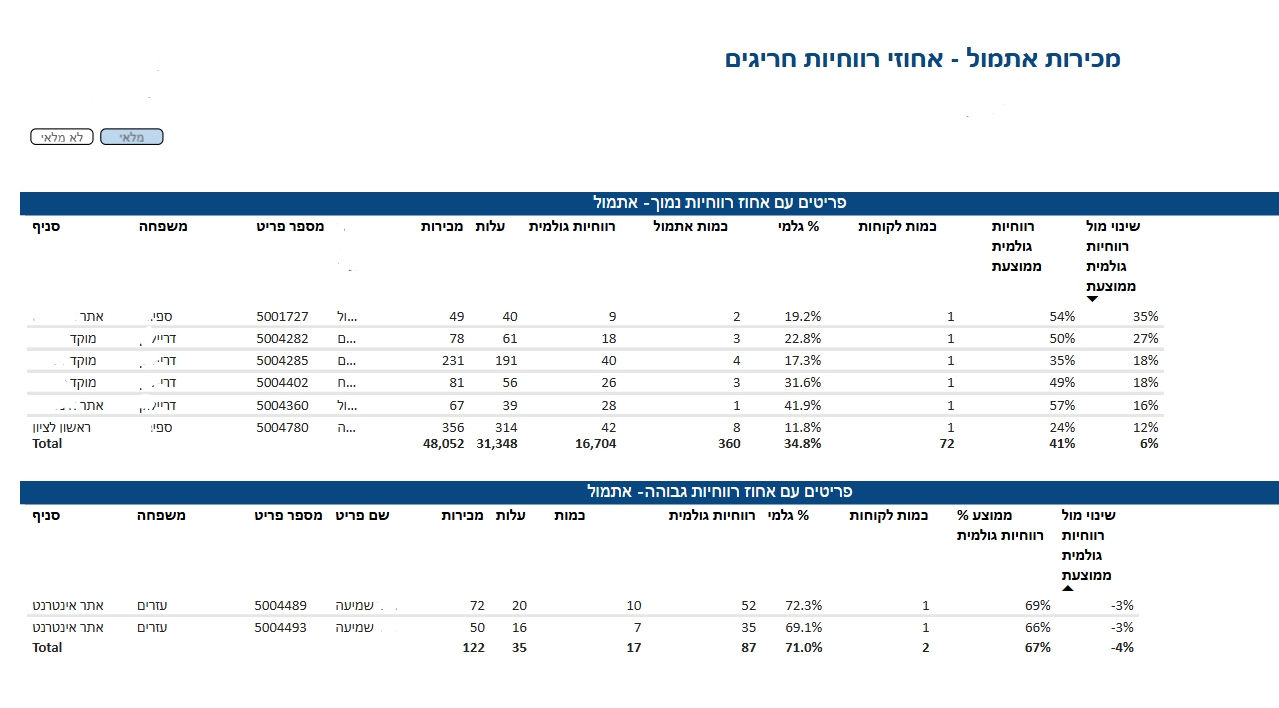
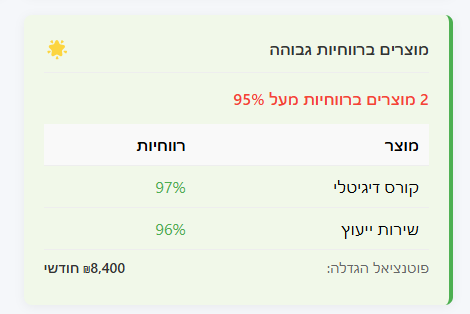
Products or services whose profitability deviated from the norm (for example, above 95% or below 30% of expected profitability).
Why it matters:
Profitability that is too low may indicate pricing problems, excessive costs, or cash leaks. Profitability that is too high may point to growth opportunities or errors in the system.
How to implement:
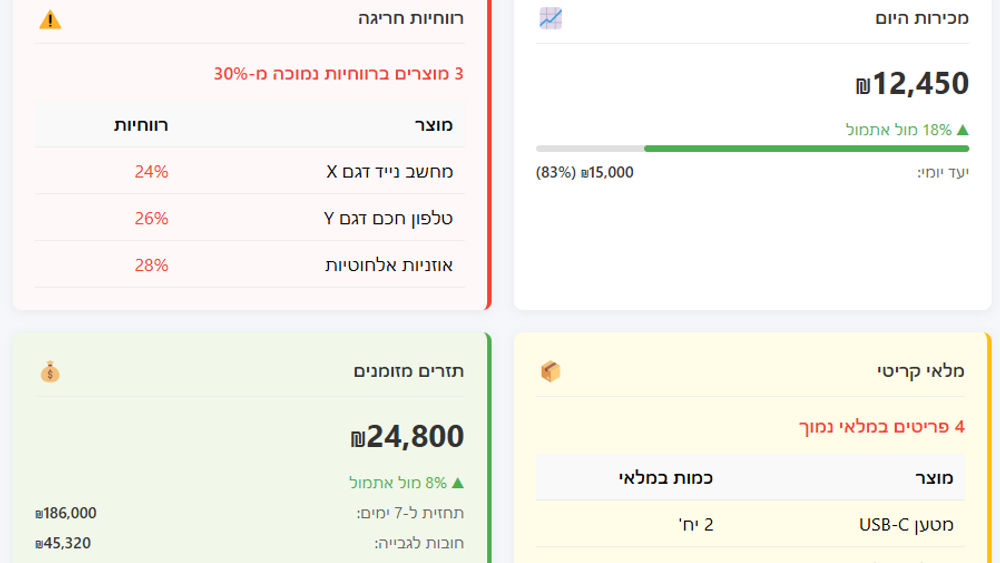
Set up automatic tracking of costs against revenue for each item or service, with alerts when the ratio deviates from the desired range. If you already have a business intelligence system, this is a report that can take about 10 minutes to prepare and will save a lot of money and time. An example is attached below.
2. Critical inventory report / missing and existing stock in the warehouse
What it shows:
Items whose inventory has fallen below a minimum threshold, or items whose inventory is too high.
Why it matters:
Inventory that is too low causes lost sales, while inventory that is too high freezes capital and increases storage costs.
How to implement:
Connect the inventory system to an automatic report that checks inventory levels against reorder points and against historical sales.
3. Daily cash-flow report
What it shows:
A daily summary of income and expenses with a 7-day forecast.
Why it matters:
Cash-flow problems are one of the main reasons businesses fail. Daily tracking lets you identify a potential shortfall in advance.
How to implement:
Set up an automatic connection to the accounting system that shows income, expenses and balance as of that day, and adds a forecast based on expected payments and collections.
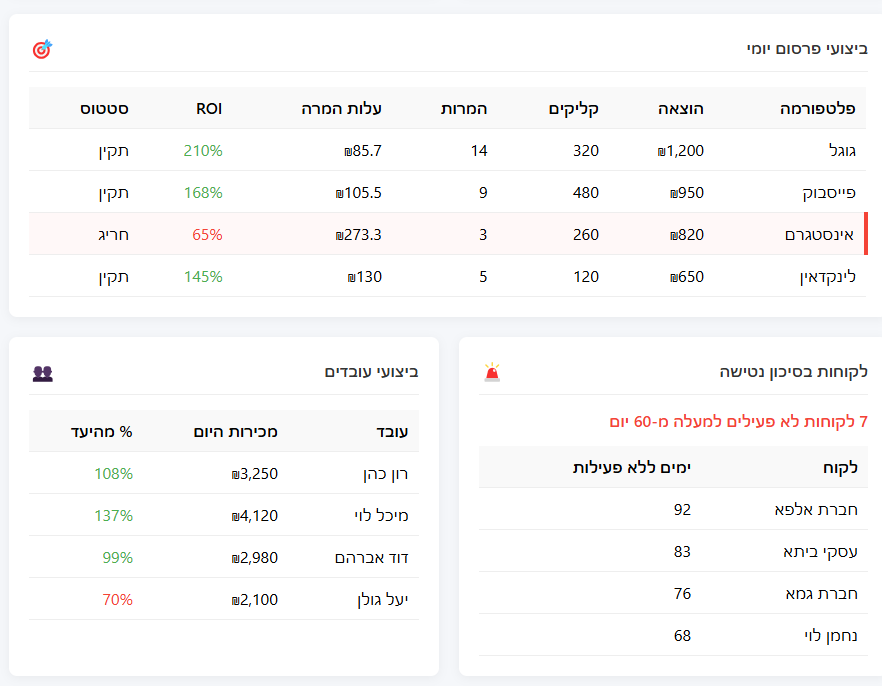
4. Advertising performance report
What it shows:
Performance of advertising campaigns in the last 24 hours (clicks, conversions, customer acquisition cost).
Why it matters:
Ineffective advertising can waste thousands of shekels quickly. Daily tracking lets you stop failing campaigns and boost the successful ones.
How to implement:
Set up an API from the advertising platforms (such as Google Ads, Facebook) that pulls data automatically and calculates basic ROI.
5. Customer activity report
What it shows:
Customers who have been inactive for 30/60/90 days.
Why it matters:
Identifying customers at risk of churn lets you take retention actions before it's too late.
How to implement:
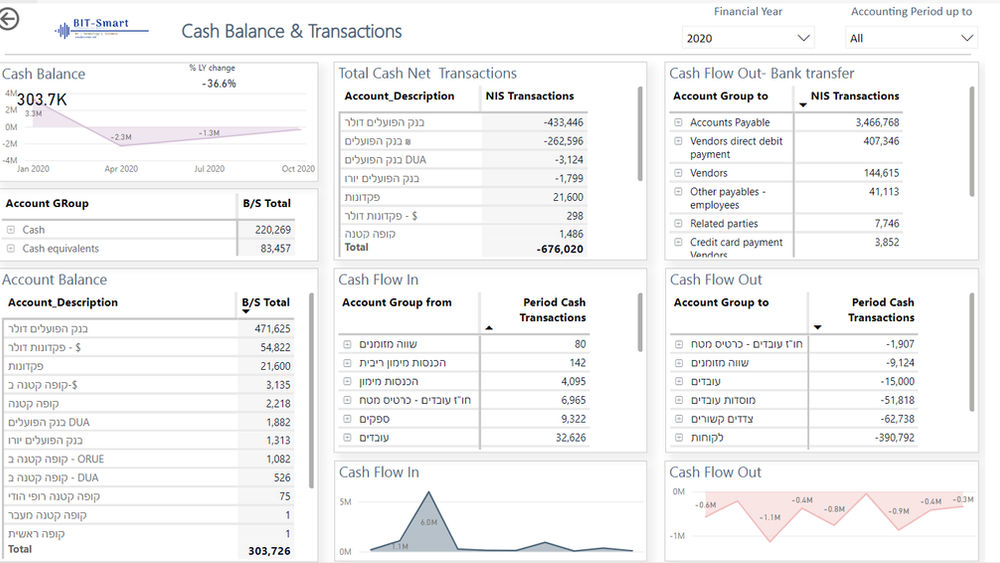
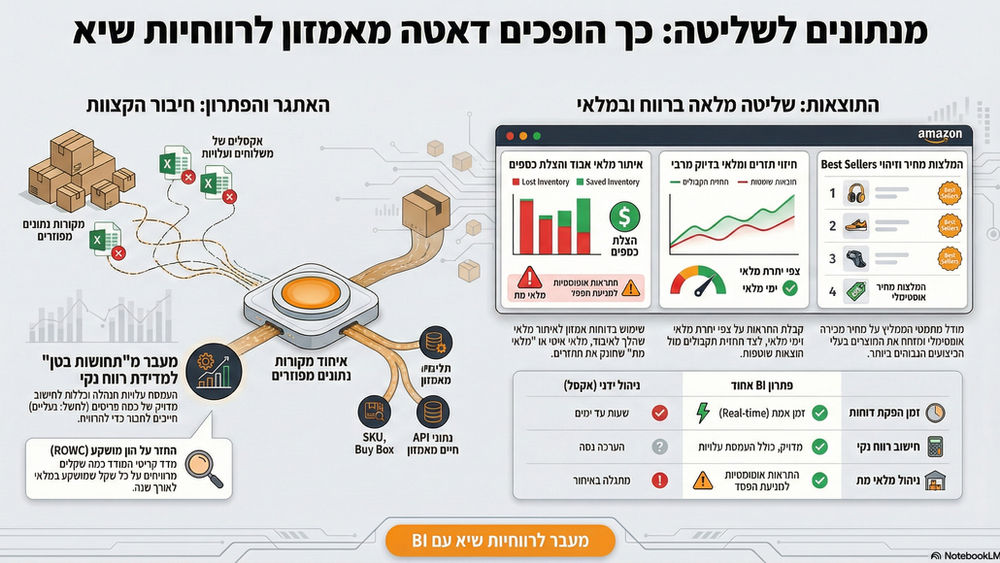
Set up a simple query in the CRM system that identifies customers whose last interaction/purchase date has passed the critical threshold. Another option, if you already have a business intelligence system and database - create an automated daily report of the results of yesterday, this week and this month
How do you build an effective automation in 10 minutes?
You don't have to be a technology expert to set up automatic reports. Here are a few guiding principles:
1. Use existing tools
Excel/Google Sheets
Both allow automatic data import and setting simple formulas.
Basic BI tools - Power BI, Tableau Public, and even Google Data Studio - all offer free or inexpensive versions.
CRM / ERP extensions - most CRM systems come with built-in reporting capabilities.
2. No-code automation
Tools such as Power Automate, Zapier, Integromat (Make) and others let you connect different systems in the business without programming:
Connecting the sales system to the inventory system
Automatically transferring sales data to a spreadsheet
Sending alerts by WhatsApp or email when there is an exception
3. Focus on the critical metrics
Don't try to measure everything from day one. Start with 2-3 metrics that are critical to your business - examples:
Store: daily sales vs. target, items with low inventory
Restaurant: cost-of-sales ratio, popular / unpopular dishes
Services: billable hours vs. working hours, customers who haven't yet renewed
Case study: how a simple report saved NIS 15,000 a month
One of our clients, an online store owner, set up a simple report that checks customer acquisition cost (CPA) in each advertising channel.
The report identified that on one platform the cost was 3 times the average, but this figure was "hidden" inside the total monthly data. After changing the campaign on that platform, he managed to save about NIS 15,000 a month, thanks to a report that took us 10 minutes to set up.
Start with small steps
You don't have to start with a complex system.
Start with one simple report:
Identify the most critical metric for your business
Set up a simple way to collect the data (even a manual update at first)
Set an exception threshold that requires intervention
Check the report every morning and act accordingly
Simple daily reports are one of the most powerful tools for running an efficient business. They don't require a large technological investment or much time, but the return on them is huge.
10 minutes of the right setup can save tens of thousands of shekels and prevent problems before they develop.
Start today with one simple report, and you'll be surprised how quickly you see the impact on your business.
What will be the first daily report you implement in your business? Share in the comments!